

Property developers and investors consider childcare centre investment resilient during the COVID-19 pandemic, unlike the stagnant property development and investment market.
For many years, the childcare industry has received strong political support from all parties due to the benefits it provides in terms of workforce participation to the Australian economy. During this challenging time, the Federal government has supported the childcare sector, it will continue to support in a post-COVID-19 Australia, to allow the returning workforce to work and maintain the Australian economy.

In this article, we discuss:
- Drivers in childcare investment
- Childcare industry trends and risks
- Factors driving demand
- Factors driving supply
- Why a childcare market research is important
- How we approach a market research for 2020 conditions
- COVID-19 impacts and forecasts
More info relating to childcare market research can be found here, including advice on how a childcare market research will benefit you as a developer and investor, and what a childcare market research usually includes to inform your investment decision.
Drivers in Childcare Centre Investment
Childcare centre investment is becoming more popular for the following reasons:
- Childcare services are considered essential social services. It is earmarked as a growing industry as a result of solid population growth, steady increase in female labour force participation rates and changing lifestyle patterns of Australians.
- Increasing investors’ confidence has been seen, evidenced by:
- Continuous and increasing government funding and support – the childcare industry is considered as a vital driver of workforce participation.
- Low capital requirements – mainly including land acquisition and building construction (meeting regulation requirements),
- Increasing female labour participation rates – the female participation rates have steadily increased and the rates are projected to continuously increase.
- Revisionary re-development potential – a childcare centre could be re-developed for a housing development site at the end of lifecycle of a childcare centre building or business. Subject to zoning flexibility, greater re-redevelopment opportunities may be possible, i.e. greater development yields for housing and mixed-use development.
- Long term leasing agreement (usually exceeding a period of 15 years) with annual fixed growth (usually 3%+) – providing much greater certainty and financial security for investors,
- Good risk profile – tenancies are usually taken by experienced operators.
- Historically higher yields – the Childcare Industry had a high revenue growth rate (3.7%) between 2015 and 2020, and this growth rate is projected to be reduced to (3.4% per year) for the next five years.
- Strong building depreciation – most of the childcare buildings are specifically designed and new centres can be strongly depreciated from a tax benefit perspective.
Childcare Centre Investment – Sector Trends & Risks
Snapshot of Asset values
It is anticipated that the childcare services industry is valued at $14.2 billion in 2019-20 with a 3.1% increase projected. Since 2015, the industry’s growth has been largely driven by higher government expenditure, increased fees and rising enrolment numbers. This period has also seen surplus capacity and declining occupancy rates in parts of key geographic markets.
As published by a major commercial real estate agency in August 2020, headline data for metropolitan childcare sales across Australia is quoted as follows:
| Financial Year | Ave. Return on Assets | Ave. Rental per Place | Ave. Sale Value | Ave. No of Childcare Places per Property |
|---|---|---|---|---|
| FY 18/19 | 6.3% | $2,600 | $3.7m | 94 |
| FY 19/20 | 5.6% | $3,000 | $4.6m | 87 |
Funding Changes in Childcare Industry
From 2 July 2018, the Federal Government introduced the Child Care Subsidy (CCS), which subsidises childcare costs for eligible families and allows subsidy paid directly to child care providers. The new funding arrangements replaced the previous Child Care Benefit (CCB) and the Child Care Rebate (CCR) schemes. The new arrangements are anticipated to encourage an additional 230,000 families to increase their hours of paid employment, through new provision of increasing flexibility, accessibility, and affordability of childcare services.
Geographic Distribution of Activity
Recent years have seen a growth in the number of new private and community-based operators. Generally speaking, the population distribution of Australian children mostly influences the industry’s geographic distribution of activity. Other influencing factors include child care costs, supply competition, labour, income and housing affordability patterns, and childcare subsidy policies. Over three-quarters of all children in approved child care services are in Australia’s major cities, with the balance participating in services situated in regional and remote areas.
Falling Children to Place Ratios
The ratios of children per place across Australian states and territories in the past years have been consistently falling, as shown in Figure 3 below. In 2019, the children per place ratios range between 4.28 in WA and 2.22 in ACT, with a national ratio of 2.94.
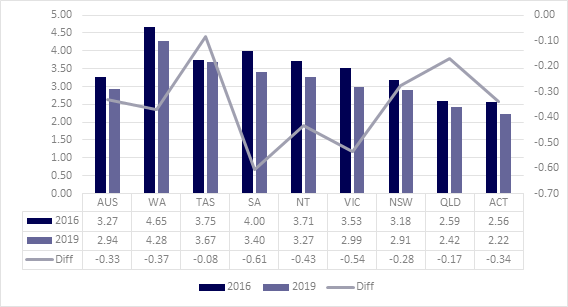
As shown in Figure 3, the supply of childcare places over-paces demand generated by population growth of children under 5.
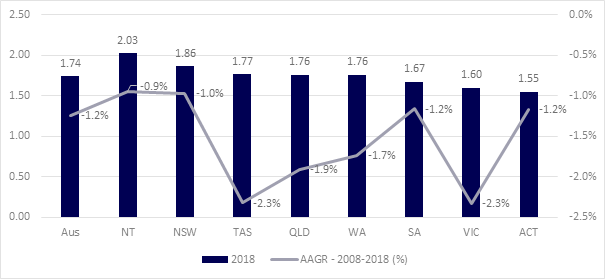
Falling Fertility Rates
The fertility rates across all states and territories are progressively declining since 1975, as shown in below figure. The fertility rate in Australia in 2018 was 1.74, and the fertility rates by state range in the order between 1.55 in Australian Capital Territory and 2.03 in Northern Territory. Victoria and New South Wales had fertility rates of 1.6 and 1.86, respectively. Victoria and Tasmania had an annualized 2.3% decrease between 2008 and 2018, which are the most noticeable rates across all states and territories.
Other Trends & Risks
- The Childcare Industry is facing increasing operating costs, for example, higher rents driven by expensive construction costs of purpose built centres.
- Industry profit margins are under pressure as a result of higher average industry wages and new regulatory requirements.
- Some major banks consider the Childcare assets risky and have downward pressure on funding (specifically construction funding).
Factors Driving Demand & Supply for Childcare Services
Solid Population Growth
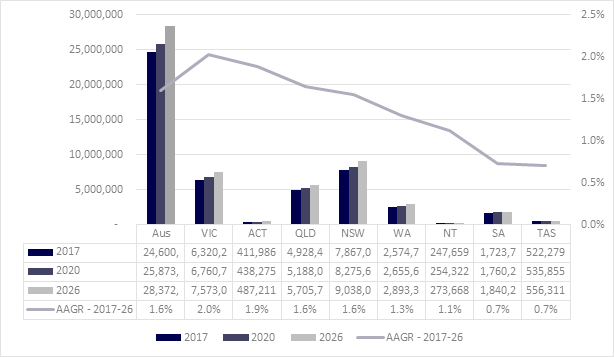
Strong population growth is projected to continue in major and regional cities. Australia’s estimated resident population at 30 June 2017 of 24.6 million people is projected to increase to between 37.4 and 49.2 million people by 2066. Three growth scenarios (low, moderate, and high) at varying growth rates are projected. The moderate growth scenario largely reflects current trends in fertility, life expectancy at birth and migration.
Figure 5 illustrates the projected population size and growth across all Australian states and territories at moderate growth rates between 2017 and 2026.
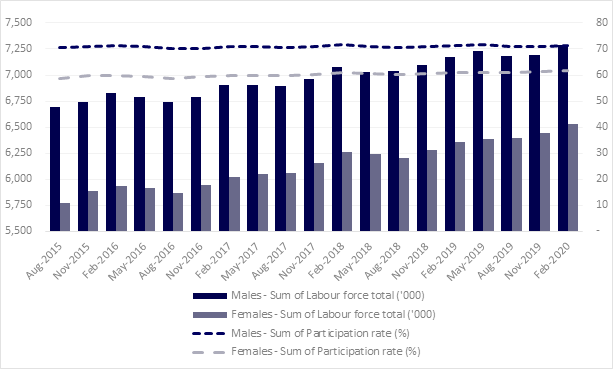
Female Labour Force Participation Rates
As shown in Figure 6, both female and male labour force participation rates have steadily increased in Australia. In February 2020, 6,533,000 females were in labour force, representing a participation rate of 61.8%, which was increased from 5,771 in August 2015 (58.8%). The growth in the female labour force participation rates (1.1% AAGR) outpaces the growth in the male labour force (0.3% AAGR).
This positive shift to female participation is in keeping with achieving greater educational attainment, better access to childcare services, more flexible working arrangements, along with progressively more recognition and support in improving gender equity.
Participation Rates in Childcare / Long Day Care Centres
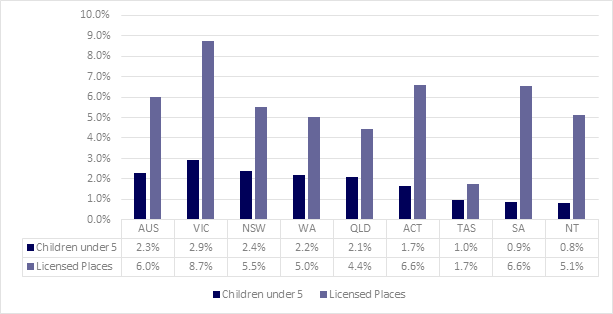
The period between 2010 and 2019 has experienced steadily increasing child participation rates in long day care. In 2019, over 44% of Australian children aged under 5 attended the long day care centres; varying attendance rates are seen across Australian states and territories, in the order of ranging from 32.7% in Northern Territory and 55.9% in Australian Capital Territory.
The average hours of attendance per week at long day care centres are generally maintained but at slightly increasing rates. In 2019, Australian children attending long day care attended approximately 24-36 hours each week across all states and territories.
Socio-demographic and Economic Factors
Socio-demographic and economic factors could significantly drive the growth of the Childcare Industry. Local operators often modify their programs to tailor for the needs of parents, by including quality educational programs (influenced under the National Quality Framework), specific programs (i.e. language teaching), much more flexible operating hours, and integrated care options. Long day care fees are also usually adjusted to cater for these “added” services, particularly in areas where parents are financially capable of paying for the services. Therefore, it is becoming important to understand local demographic and economic profiles and the parents’ expectations and design the centre programs to differentiate a centre from competing centres.
Current Competition and Level of Supply in Childcare Places
Ability of operators to achieve and maintain occupancy rates in the order of 70% to remain sufficiently profitable.
COIVD-19 Impacts on Childcare Industry
Reiterated Importance of Childcare Industry
The childcare industry has political support from all parties due to the benefits it provides in terms of workforce participation to the Australian economy. The Federal Government provided assistance packages to the industry as early as 2 April due to COVID-19. This included the Early Childhood Education and Care Relief Package which provided fee-free childcare for families. From 13 July, the Child Care Subsidy (CCS) and Additional Child Care Subsidy (ACCS) recommenced, along with new measures to support the sector and its families through the transition, including a relaxed activity test for families and a new Transition Payment for providers. A Recovery Package is the next stage in support for the industry, to commence from 28 September to 31 January 2021. It includes a 25% recovery payment for Victoria, an additional 15% payment for Outside School Hours Care services in Victoria and future support if further COVID-19 outbreaks occur throughout the country.
Shifts in Occupancy and Absences Levels
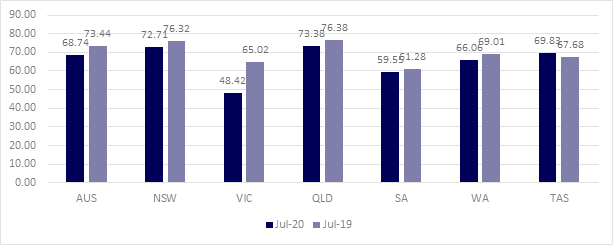
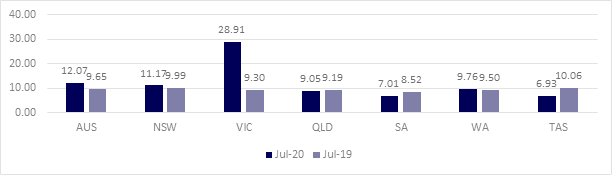
COVID-19 has already caused some to moderate impacts on occupancy levels across Australia, depending on levels of restrictions to help prevent the spread of COVID-19. Metropolitan Melbourne is the only area which had Stage 4 restrictions, with many businesses across a wide range of sectors being closed or largely reduced in terms of operating scales. A major Childcare Management System provider used aggregated data from 1,300 providers nationally; occupancy levels by state or territory are compared between July 2020 vs July 2019, as shown in Figures 7 & 8.
Changes in Family Needs and Behaviors
Living in a changing world, most childcare centres have progressively adapted and improved to respond to the changes already seen. With COVID-19, it does not appear so far that it has caused large scale disruptive changes to the childcare industry. However, it is believed that COVID-19 could influence working habits (i.e. working from home), changes in employment and family needs, which will ultimately have an effect on childcare participation and attendance rates (i.e. number of hours of care in need each week).
Impacts on Australian Population Growth
Australian population growth is critical to the future of the childcare industry. The population growth has been negatively impacted by COVID-19. The Australian Government is working hard to catch up the loss of growth. Despite this, how to continue to grow our population will be critical to the childcare industry.
Other Possible Impacts
Other possible impacts driven by COVID-19 include:
- Expected moderate-low growth in rent in a short term due to low overseas migration rates, increasing unemployment rates and unknown childcare participation and attendance rates, impacted by COVID-19.
- It is projected by a private operator that 80-90% of operational performance prior to COVID-19 is expected.
- Expected to see a period of limited investment
- Unemployment rates are projected to increase, particularly post COVID-19.
How does a Childcare Market Research / Assessment benefit you as a property developer and investor?
Do you know understanding the dynamics of individual childcare markets at a local level before investing is crucial to the success of your childcare centre investment?
So, what is a market assessment for a childcare centre? It is also known as a Childcare Centre Needs Assessment. It is essentially a rigorous and forward-looking assessment for childcare services, to inform local market opportunities and operating risks. A good market assessment for a childcare centre will review the industry outlook and trends, policy framework, and assess local demand and supply in long day care services to evaluate:
- Adequate level of childcare services in a given catchment to ensure viability, and
- Number of additional licensed places required to cater for population growth of children aged up to 5 years.
Any centres with reduced operational risks (at acceptable levels) will be greatly valued. Therefore, it is important to conduct a market assessment to help you identify investment and development opportunities and mitigate development and financial risks. For example, all operators will likely experience difficulties in making a profit in a market with too much competition or not enough demand. Another example would be to develop a larger childcare centre in a location where demand for a smaller childcare is anticipated.
Our work will assist you in making an informed investment and business decision in many ways:
- Acquiring a site,
- Preparing a business plan,
- Supporting a town planning application,
- Supporting a rezoning proposal,
- Developing an appropriate sales or leasing marketing campaign, or
- Operating a business.
To find out more about what we typically included in our childcare market assessments (also known as childcare needs assessments), please click here. Our turnaround timeframe for a condensed childcare market assessment is 14 business days.
Conclusions
The following trends in the Childcare Industry can be summarised as follows:
- Childcare is an Essential Social Service;
- Government funding and support is continuing due to its driver in workforce participation;
- Low capital requirements, good risk profile and high yields for Childcare Centres;
- Falling children to place ratios and declining fertility rates are seen against solid population growth and child participation rates in long day care from 2010-2019;
- Socio-economic and demographic factors could drive growth of the Childcare Industry;
- Smaller centres have lower risks and the majority of operators offer 90-100 place centres; and
- COVID implications in the next 1-2 years, such as unemployment, is likely to see some fluctuating fortunes for the Childcare Industry.
Other Related Articles
Investment Guides in Childcare Centre Property Investment and Development
Explore PPC Urban’s insightful investment guides for property development, focusing on childcare, healthcare, commercial projects, specialist disability accommodation (SDA), subdivision, townhouses, and apartments. Beneficial for property developers, investors, and consultants at all levels.
Please click here to download our Investment Guides for a Childcare Centre investment.